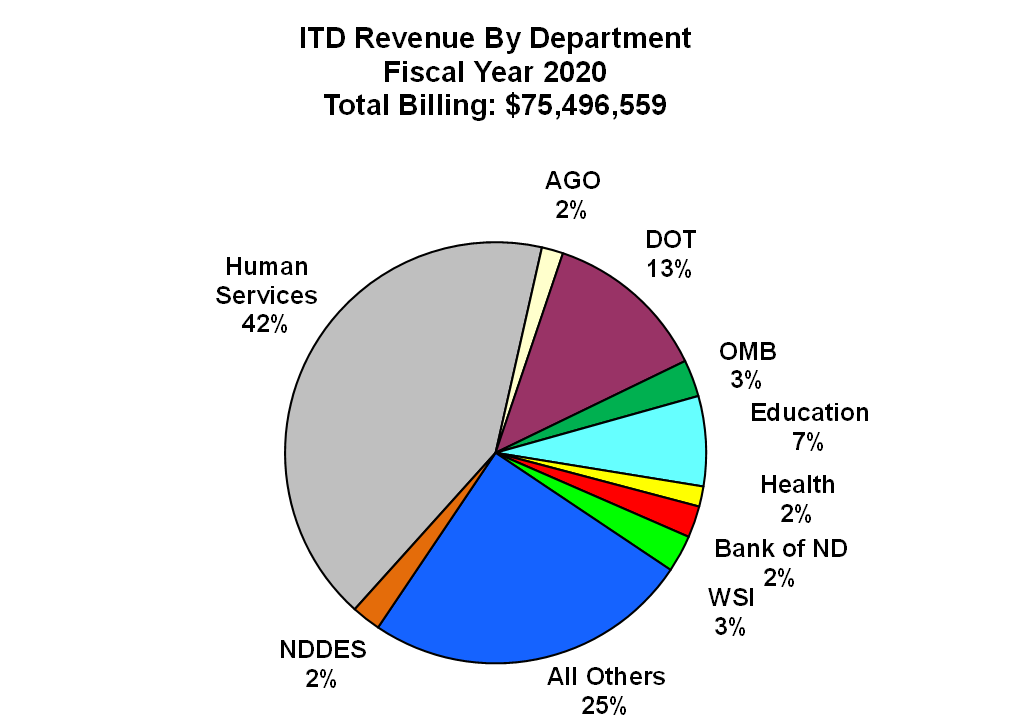
T
Revenue By Department
Fiscal Year 2020
Total Billing $75,496,559.29
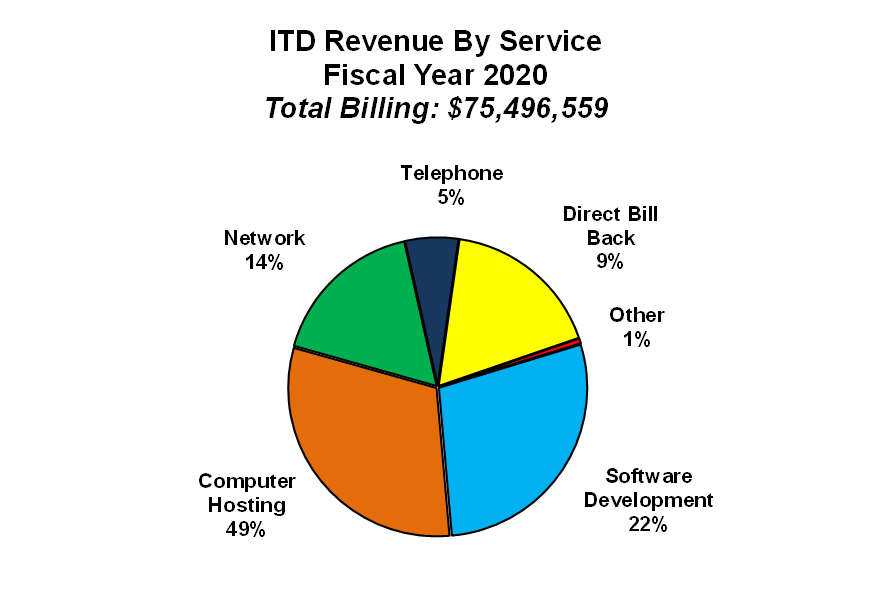
NDIT Revenue By Service
Fiscal Year 2020
Total Billing:$75,496,559.29
Rate Comparison and Trends
IT Support
| Enterprise | Location | Developers |
| ITD | State of ND | 76 - 132 |
| Applied Engineering | Bismarck, ND | 105 - 115 |
| Infotekka | Albuquerque, NM | 106 - 128 |
| Connvertex Technologies | South Jordan, UT | 80 -90 |
| Nexus Innovations | Bismarck, ND | 105 - 125 |
| Agency MABU | Bismarck, ND | 75 - 80 |
| Prominent Technology | Bismarck, ND | 92 - 122 |
| Bpro, Inc | Pierre, SD | 80 - 90 |
| Integration Architects | Minneapolis, MN | 107 - 117 |
| QA Technologies | Omaha, NE | 82 - 95 |
| TEK Systems | Atlanta, GA | 92 - 110 |
Rates as of July 2020
| North Dakota | South Dakota | Montana | Minnesota | |
| ITD | BIT | ITSD | MNIT | |
| Staffing | ||||
| Senior Analyst | 114.00/hr | 86.00/hr | 127.78/hr | 95.70/hr |
| Server Administrator | 99.0/hr | ** | 134.28/hr | 95.70/hr |
**Costs vary based on Statement of Work ***DBA and Server Admin. Rates included in info Management fee below
| Central Computer CPU | ||||
| Batch CPU | .64 | .61 | 1.72/user id | .02 |
| CICS CPU | .64 | .61 | 1.68/user id | .05 |
| ADABAS CPU | .64 | .61 | 1.20/user id | .01 |
| TSO CPU | .64 | .61 | 1.90/user id | 1.21 |
*SD also charges $.03 per 1000 I/Os
**MN uses service units to bill rather than CPU seconds. This is because they run three different processors.
| Network Fees | ||||
| Technology Fee* | 66.25 | 106.00 | 86.79 | 109.60 |
| Info / Enterprise Mgmt Fee* | included | 59.25 | ||
| Desktop Support | 100.00/PC/Mo | In Tech Fee (Excludes Hardware) | 92.38 / Mo. | 71.96/Mo. |
| DSL Service | Cost + 175.00 | Actual | Actual | 148.16 |
| ETS-10 (10mbps bandwidth) | 850.00 | Actual | Actual | 779.72 |
| *Per domain account | ||||
| Telephone Fees | ||||
| Telephone Line | 23.00 - VoIP | 18.00 - Analog | 24.04 - VoIP | 25.50 - VoIP |
| Voicemail (unlimited) | 5.00 | 6.00 | 1.03 | |
| (3 minute limit) | 3.77 | |||
| (per additional minute) | 2.23 | |||
| Long Distance | North Dakota | South Dakota | Montana | Minnesota |
| In-State | .045 | .08 | .06 | .069 |
| Out-of-State | .045 | .08 | .06 | .069 |
| 800 Service | .05 | .08 | .07 | .048 |
Service Rate Trends
| Jul '15 | Jul '16 | Jul '17 | Jul '18 | Jul '19 | Jul '20 | |
| Software Development | ||||||
| Senior Analyst | 105.00 | 105.00 | 114.00 | 114.00 | 114.00 | 114.00 |
| System Analyst II | 75.00 | 81.00 | 81.00 | 85.00 | ||
| Programmer | 73.00 | 73.00 | 76.00 | 76.00 | 76.00 | |
| Central Computer CPU | ||||||
| Batch CPU | .64 | .64 | .64 | .64 | .64 | .64 |
| CICS CPU | .64 | .64 | .64 | .64 | .64 | .64 |
| ADABAS CPU | .64 | .64 | .64 | .64 | .64 | .64 |
| TSO CPU | .64 | .64 | .64 | .64 | .64 | .64 |
| Network Fees | ||||||
| Device Fee | 59.00 | 59.00 | 64.00 | 64.00 | 66.25 | 66.25 |
| ETS-10 | 765.00 | 765.00 | 850.00 | 850.00 | 850.00 | 850.00 |
| *Base connectivity became an ETS-10 in July 2017 | ||||||
| Telephone Fees | ||||||
| Telephone Line | 20.00 | 20.00 | 20.00 | 20.00 | 23.00 | 23.00 |
| Speaker/Display | 3.00 | 3.00 | 3.00 | 3.00 | 0.00 | 0.00 |
| Voicemail (unlimited) | 5.00 | 5.00 | 5.00 | 5.00 | 5.00 | 5.00 |
| Long Distance | ||||||
| In-State | .05 | .045 | .045 | .045 | .045 | .045 |
| Out-of-State | .05 | .045 | .045 | .045 | .045 | .045 |
| 800 Service | .05 | .05 | .05 | .05 | .05 | .05 |
Financial Statements
Statement of Net Assets June 30, 2019 & 2018
| ASSETS | FY 2019 | FY 2018 | ||||
| Current Assets: | ||||||
| Cash Deposits at BND | 14,061,789 | 13,992,510 | ||||
| Intergovernmental Receivables | 273,442 | 513,748 | ||||
| Accounts Receivable | 139,442 | 130,792 | ||||
| Due From Other Funds | 6,506,738 | 6,136,597 | ||||
| Prepaid Items | 3,956,347 | 3,512,774 | ||||
| Total Current Assets | 24,937,758 | 24,286,421 | ||||
| Noncurrent Assets: | ||||||
| Building & Equipment - Net | 4,430,537 | 4,214,580 | ||||
| Total Non-current Assets | 4,430,537 | 4,214,580 | ||||
| Total Assets | 29,368,295 | 28,501,001 | ||||
| DEFERRED OUTFLOWS OF RESOURCES | ||||||
| Derived from Pensions | 13,645,506 | 16,306,473 | ||||
| TOTAL ASSETS & DEFERRED OUTFLOWS | 43,013,801 | 44,807,474 | ||||
| LIABILITIES | ||||||
| Current Liabilities: | ||||||
| Accrued Payroll | 2,267,836 | 2,332,900 | ||||
| Accounts Payable | 266,359 | 1,302,004 | ||||
| Due to Other Funds | -12,177 | 447,798 | ||||
| Total Current Liabilities | 2,522,018 | 4,082,702 | ||||
| Noncurrent Liabilities: | ||||||
| Compensated Absences Payable | 2,256,200 | 2,239,843 | ||||
| Net Pension Liability | 32,629,873 | 31,693,120 | ||||
| Total Non-current Liabilities | 36,330,645 | 35,416,833 | ||||
| Total Liabilities | 38,852,663 | 39,499,535 | ||||
| DEFERRED INFLOWS OF RESOURCES | ||||||
| Derived from Pensions | 2,679,558 | 1,591,237 | ||||
| NET POSITION | ||||||
| Invested in Capitol Assets, Net of Related Debt | 4,430,537 | 4,214,580 | ||||
| Unrestricted | (2,948,956) | (497,878) | ||||
| Total Net Position | 1,481,581 | 3,716,702 | ||||
| TOTAL LIABILITIES, DEFERRED INFLOWS & NET POSITION | 43,013,802 | 44,807,474 | ||||
Statement of Revenues, Expenses, and Changes in Fund Net Position for years ending June 30th, 2019 & 2018
| FY 2019 | FY 2018 | |||
| OPERATING REVENUE: | ||||
| Sales and Services | 65,354,963 | 62,619,324 | ||
| OPERATING EXPENSES: | ||||
| Salaries and Benefits | 32,675,073 | 31,250,062 | ||
| Operating | 32,122,915 | 28,603,871 | ||
| Depreciation | 2,752,815 | 4,280,005 | ||
| TOTAL OPERATING EXPENSES | 67,550,803 | 64,133,938 | ||
| OPERATING INCOME (LOSS) | (2,195,840) | (1,514,614) | ||
| NON-OPERATING REVENUES (EXPENSES): | ||||
| Loss on Sale of Capital Assets | (39,281) | (0) | ||
| TOTAL NON-OPERATING REVENUE (EXPENSES) | (39,281) | (0) | ||
| INCOME (LOSS) BEFORE CONTRIBUTIONS AND TRANSFERS | (2,235,121) | (1,514,614) | ||
| TOTAL NET POSITION-BEGINNING OF YEAR | 3,716,702 | 5,231,316 | ||
| TOTAL NET POSITION-END OF YEAR | 1,481,581 | 3,716,702 | ||